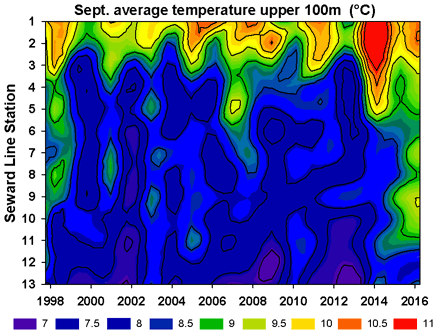
The 20 years of observations along the Seward Line capture the temperature signal of inter-annual variation in the average temperature of the upper 100m of the water column: an index of the heat present in the upper ocean.
Cruises each May (upper left) have been relatively consistent in their timing, yet we can see a 3°C (5.5°F) temperature range across years. 1998 was one of the strongest El Ninos in recent decades, while 2003 was a moderate El Nino with the heating affect magnified by a 2-3 week delay in cruise timing. In contrast, 2007-2009 were consistently colder than the rest of the observation period. The double whamy of "blob and El Nino in 2016 has resulted in the largest warm anomoly to date.
These difference have consequences for the timing of the spring phytoplankton bloom: typically earlier and smaller in warm years, later and larger in cold years. Temperature also influences the growth rate of zooplankton, with faster growth in warm years producing typically earlier, smaller and shorter peaks of zooplankton, while colder years typically have later, larger and longer zooplankton peaks.
Cruises in August/September (lower left) show a much stronger inshore-offshore difference in temperature, with much more heat trapped in the Alaska Coastal current. Differences between years generally appear less striking, with no clear correlation between spring and late summer temperatures. Notable exceptions occurs in 2014 and 2016 where temperatures are well above above average, even more so than the 1998 El Nino. The waters in the Alaska Coastal Current can provide a highway for southern warm-water species into the coastal Gulf of Alaska when conditions are favorable.
Warmer-waters in both seasons tend to accelerate the growth rate of commercial species - but only if there is enough food to sustain their higher growth rates. Hence, there is a delicate balance for many species between cold years with more food and warm years with higher potential growth!
Animations and Time-series sections
Seward Line: Monthly temperature, Monthly Salinity
Seward Line: 1997-2004
Time Series Temperature, Salinity
FairField Line: Monthly temperature, Monthly Salinity
FairField Line: 1997-2000
Time Series Temperature, Salinity


